The Object Browser panel allows you to view and
work with the data elements in the report and available in the application.
Within the Vector Securities
application there are multiple types of objects; these include database
elements such as attributes and metrics as well as application elements
such as predefined filter objects and prompts. These objects are used
to create and customize reports.
The Object Browser panel has the following views:
· Report Objects
- this view presents all the attributes and metrics selected to be included
in the output dataset for the new or customized report.
· All Objects
- this view presents all the data objects in the application; this includes
attributes, metrics and predefined filter objects.
· Related Reports
- this view displays all related reports that have at least one data element
in common with the selected new or customized report.
The Report Objects view presents all attributes
and metrics included in the output dataset of the report being displayed.
Attributes and metrics that are currently included in the grid or graph
are displayed with a grey font and those not included in the current view
are displayed with black font.
You may move attributes and metrics off the current
view of the output; these data elements are still included in the output
dataset but are not included in the current grid or graph view. This simply
hides the data elements from the grid or graph view, the output dataset
is not regenerated. You may also remove data elements from the report
all together. When you remove data elements from the report, it is re-executed
and a new output dataset is generated excluding those data elements.
When
you click the Report Objects navigator option  the Report Objects panel is displayed in the Object Browser.
Attributes  are
noted with a cube icon and will provide an expandable drop down
to select the attribute "form" to be displayed in the
output. Attribute forms represent the different type of values
associated with an attribute (e.g., for CBSA, the ID form is the
numeric value of the CBSA and the DESC form is the description
of the CBSA). are
noted with a cube icon and will provide an expandable drop down
to select the attribute "form" to be displayed in the
output. Attribute forms represent the different type of values
associated with an attribute (e.g., for CBSA, the ID form is the
numeric value of the CBSA and the DESC form is the description
of the CBSA).
Application metrics  are noted with a ruler. These metrics are defined as part of the
overall application attributes and metrics available for reporting.
are noted with a ruler. These metrics are defined as part of the
overall application attributes and metrics available for reporting.
Derived metrics  are noted with a function icon. These type of metrics represent
calculations you have manually added to the report using application
metrics currently included in the output dataset.
are noted with a function icon. These type of metrics represent
calculations you have manually added to the report using application
metrics currently included in the output dataset.

|

|
This view option is similar to the Report Objects
view but presents all attributes and metrics included in the application
(as opposed to the Report Objects which only shows the attributes and
metrics in the report output). You may add data elements to the current
output dataset from this view. When you add a new data element, the report
is re-executed and a new output dataset is generated with the addition
of the selected attributes and/or metrics.
You may
also customize the panel view to include a Shortcuts window that will
provide a shortcut to the most commonly used application folder (e.g.,
Attributes, Metrics, My Reports) to access these without the need to navigate.
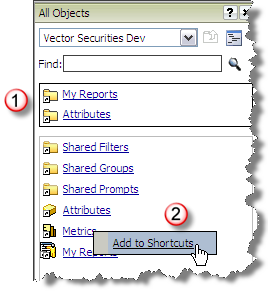
This window will only be presented if you have shortcuts defined. To add
an item to the shortcuts, right click the item and select the Shortcut
option as demonstrated below to add the Metrics link to the Shortcuts
window.
In the example to the left,
the Shortcuts window
has links to My Reports and Attributes folders. The list below
is the current application folders for the highest search level
within Vector Securities.
You may right-click an item in
the list and add the
folder to the Shortcuts window (e.g., Metrics folder will be added
to the Shortcuts you have defined for your user account). |
|
When
you click the All Objects navigator option
the All Objects panel is displayed in the Object Browser.
This view allows you to browse
all application folders from the drop down list to find the data elements you would like to add
to the report. You may also use the Find option to search for
and select the data element by its name.
The
Shortcuts window in
the All Objects panel allows you to add the most commonly used
application folders. This window will remain static as you navigate
through application folders.
Note:
The Metrics folder appears in the Shortcuts window after being
added as shown in the example above.
The list of objects
will be refreshed as you navigate through
the application folders. The highest level of data objects in
Vector Securities
will display shortcuts to the most commonly used folders and data
elements (e.g., Shared folders for filters, groups and prompts;
a master list of attributes and metrics; or the data elements
in your My Reports folder).
As with the Report Objects view,
the attributes are identified with the cube icon and metrics with
the ruler. |

|
This view allows you to see all reports that are
included in the folder where your current report is saved. If you have
selected the Create Report option and have not saved the report, the current
Create Report options are displayed in this panel. If you are viewing
the Object Browser from the Report Output page, the folder where the original
report definition is stored is used for the list of reports. You can run
any of the reports included in this list directly from the Object Browser.
When
you click the Related Reports navigator option
the Related Reports panel is displayed in the Object Browser.
All reports that are contained
in the folder where the current report is saved will be presented
.
The current report is displayed
with color text and the additional reports are presented as hyperlinks.
These hyperlinks allow you to run the report directly from the
Object Browser. |

|