Vector Securities
provides a set of predefined reports for each module based on the most
commonly requested analysis. The application allows you to customize existing
reports or create your own custom reports. As noted previously, a report
definition is comprised of two components:
· Report
Filter - conditions applied to the source data to determine the records
eligible for the output results.
· Report
Template - the set of attributes and metrics defined for the output dataset
along with the layout of the output (i.e., placement of the data elements
as rows, columns or page by for a grid view or as series, categories or
page by for a graph view).
When creating or customizing a report, you must have
at least one filter condition and whatever data elements you need in the
output to perform your analysis. The option to create a new report presents
a blank report layout in design mode for you to work with. You simply
drag and drop the data elements you wish to include in the output onto
the template and define the conditions for the report filter.
· Create a new grid report
· Create a new graph report
· Customize existing report
Create a Grid Report from Blank Definition Back
to Previous
Vector Securities
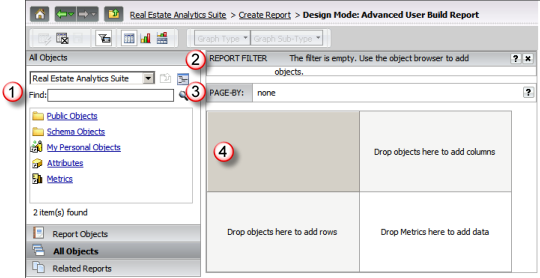
includes a Advanced User Build Report Create Report option
that provides access to design mode for a blank grid report definition.
This option allows you to build your own custom report by defining the
filter conditions and the data elements you wish to include on the report.
As noted in the Report Terminology topic, a report is
comprised of a set of report filter conditions and a report definition
which specifies the attributes and metrics included in the output and
the layout (or presentation) of those data elements. When you access the
Advanced User Build Report option, the following report design page is
presented:

|
Object Browser Panel
This panel provides access to the list
of attributes and metrics in the application available for selection.

|

|

|
Report Filter Panel
This panel allows you to build the filter
conditions that will be applied to the source data to generate
the output dataset |

|
Page By Panel
This panel allows you to define the
parameters to display the output dataset as pages based on the
values of the attributes. |

|
Grid
The grid design allows you to specify
the placement of attributes and metrics when viewing the output
dataset in a grid.
Rows drop area represents the data attributes
you wish to use for reporting. The columns itemize the metrics
based on the values for the attributes that are used for the rows.
Columns drop are represents the data
attributes and metrics you wish to use for reporting by the row
values. |
Create a New Graph Report from a Blank Report Definition Back
to Previous
Vector Securities
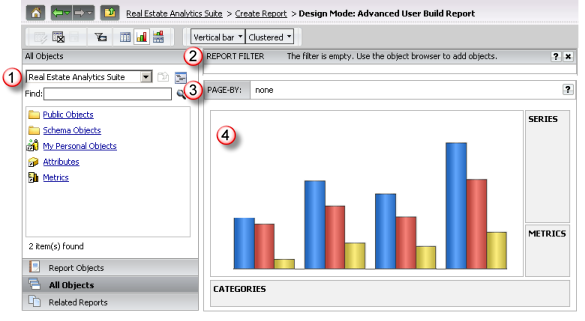
includes a an Advanced User Build Report a Create Report option
that provides access to design mode for a blank graph report definition.
This option allows you to build your own custom report by defining the
filter conditions and the data elements you wish to include on the report.
As noted in the Report Terminology topic, a report is
comprised of a set of report filter conditions and a report definition
which specifies the attributes and metrics included in the output and
the layout (or presentation) of those data elements. When you access the
Advanced User Build Report option, the following report design page is
presented:

|
Object Browser Panel
This panel provides access to the list
of attributes and metrics in the application available for selection.

|

|

|
Report Filter Panel
This panel allows you to build the filter
conditions that will be applied to the source data to generate
the output dataset |

|
Page By Panel
This panel allows you to define the
parameters to display the output dataset as pages based on the
values of the attributes. |

|
Graph
The graph design allows you to specify
the metrics, the series to be plotted and the categories for the
X-axis used for plotting the series on the graph.
Series drop area represents the plotted
graph line.
Metrics drop area represents the metrics
that are to be included on the graph.
Categories drop area represents the
X axis data element for graphing. |
When you run a standard predefined report from Shared
Reports, the output is placed in your History List once it is completed.
When you view the results from the Report Output page, you may customize
the report as needed. You may add or remove data elements and modify the
layout; you may also change the presentation to display the output in
grid, graph or map view. You may apply these customizations directly from
the Report Output page or by viewing the report definition from the Design
mode.
When customizing a report from the Report Output page,
you are working with live data and any modifications you make to add or
remove attributes and/or metrics will regenerate a new output dataset
as you do the customization. This is not an optimal utilization of the
report resources.
Once you have customized the report to suit your business
requirements, you may save the customized report to My Reports (for your
own use) or your company shared folder in Shared Reports (to share with
individuals in your workgroup). Once saved, the customized report is available
to you as another report option within the application.
![]()
![]()

![]()
![]()
![]()
